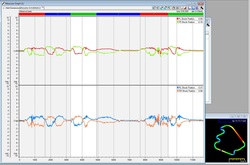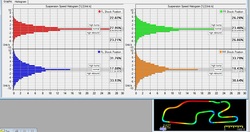
Check out this trace and see what you notice. The top graph is the front shock positions and the bottom is the rear shock positions.
 Ever notice one car doesn’t look as good over the bumps as another. Most times we chalk it up to better dampers, different suspension designs, or even the driver’s skill and/or track position when they hit the bumps. While those things certainly play a major role in how the car looks and handles, sometimes there is more at play. Check out this trace and see what you notice. The top graph is the front shock positions and the bottom is the rear shock positions.
0 Comments
 Shock data can be used for many different things. Lots of times, it’s thought that the shock data is only good for tuning – finding that sweet spot of dampening. Just as often, the shock data can show other things, especially when something is wrong in the suspension. While the data won’t tell us exactly what is wrong, it can show us symptoms of the root cause and allow us to dig deeper. |
Featured ArticlesHere is a collection of articles from some of the best professional coaches, drivers, and data engineers. Archives
May 2017
Categories
All
|
