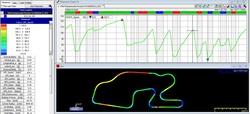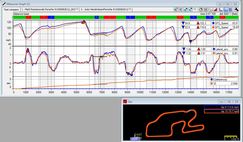
 Just like we looked at a couple of Featured Articles ago, some people like graphs and some people like video. Well, some folks like to look at a track map and have data over-layed onto it. This is most commonly done with colors – you know – those colorful rainbow maps with the different bands.
2 Comments
Or as Buddy Fey says in Data Power, "Brakes are like lawyers - they cost you every time you use them."
I've been reading through the book again and I'm amazed at the number of good rules of thumb, insights, and concepts that Buddy lays out for you to use. Even though it's expensive, Data Power is worth every penny!  Everyone knows the old adage “A picture is worth a thousand words.” In data, we use all kinds of pictures – regular graphs, XY plots, histograms, and many more. Those graphs, while technically pictures, sometimes lend themselves to those with a “math mind.” When we add video to the data, it really adds 1,000 words. |
Featured ArticlesHere is a collection of articles from some of the best professional coaches, drivers, and data engineers. Archives
May 2017
Categories
All
|

 RSS Feed
