TrailBrake.net
  • Home
  • Featured Articles
  • Online Store
  • Resources
  • Data Reading
  • Contacts

Shocking Problems II

9/24/2013

0 Comments

 
The Whole Track
Ever notice one car doesn’t look as good over the bumps as another. Most times we chalk it up to better dampers, different suspension designs, or even the driver’s skill and/or track position when they hit the bumps. While those things certainly play a major role in how the car looks and handles, sometimes there is more at play.

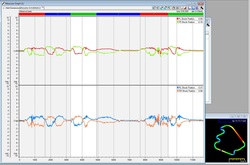
Check out this trace and see what you notice. The top graph is the front shock positions and the bottom is the rear shock positions.

Picture
When the shock position starts to go into compression (up in the graph), the lines start to flatten out and not show as much small amplitude bumps. The rear, while moving a similar amount, still has a lot of small movements in the shock positions. You see this as the rear shock still plateaus, but has lots of small movements versus the front that seems to flat line. This is a result of the front suspension going into the bump stops. The front suspension gets into the bump stops which starts to increase the effective springs rates at an increasing rate.

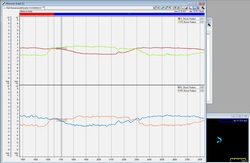
When we zoom into a smaller one corner section, we can see the same thing happening. You can see the front shock position move to a certain position and then it doesn’t change  much. At the rear, we can see that even when it goes approaches the limit of how compressed it will be, it still has a number of small movements. Those small movements are the car absorbing small road irregularities when loaded for a corner. 


Picture
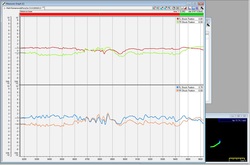
If we zoom into a portion of the graph right before a corner when the front suspension hits the bump stops, we can see the it does move similar to the rear with lots of little movements in the overall trend. In this center of this graph, we can see that when the front suspension is close to the 0 position (center of the graph) it has similar little bumps to the rear.

When analyzing your data, you have to compare what you are actually getting to what you would expect. In this case, you expect the suspension to always be absorbing bumps, so when it stops doing that, you have to look at why. This applies to many areas, like lateral acceleration to each side – they should be roughly equal for equal turns, engine speed to wheel speed – the clutch shouldn’t be slipping, steering angle to lateral G – a rough over/understeer measurement, and many more items. The more ways you can dig into your data, the more you will get out of it and the faster you can go.


0 Comments


Leave a Reply.

    Featured Articles

    Here is a collection of articles from some of the best professional coaches, drivers, and data engineers.

    Archives

    May 2017
    December 2016
    November 2016
    July 2015
    March 2015
    January 2015
    December 2014
    January 2014
    December 2013
    September 2013
    August 2013
    June 2013
    May 2013
    April 2013
    September 2012
    August 2012
    May 2012
    January 2012
    December 2011
    November 2011

    Categories

    All
    Aim
    Books
    Braking
    Cds
    Coaching
    Coasting
    Data
    Dave Scott
    Friction Circle
    G-G
    Gps
    Lap Compare
    Lap Time
    Lat G
    Long G
    Motec
    Mph
    MXS
    Neel Vasavada
    Overlay
    Part Tracking
    Peter Krause
    Racecar Tracking
    Reading
    Sensors
    Shifting
    Shock Pots
    Shocks
    Solo
    Stack
    Steering
    String Pot
    Throttle Position
    Time Variance
    Track Map
    Trail Braking
    Transistions
    Transitions
    Traqmate
    Video
    X-Y

    RSS Feed

Copyright © 2014 Trailbrake.net
TrailBrake.net 603-674-3250
Manchester, NH