
Take a look at your data. How do you shifts look? Any room for improvement?
|
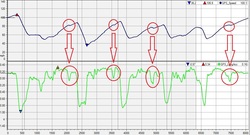
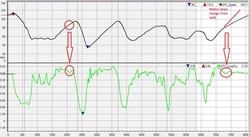
Shifting technique can make a big difference in lap times. I’ve seen bad shifts take as much as 1.2 seconds on an old H box. Good shifts in a new BMW - .4 seconds! The delta of .8 seconds is time that you are not accelerating and maybe even decelerating. A good working transmission and tight shift linkage can make a big difference to quick laps times.  To see the shifts in the data is pretty easy. Take a look at the first graph of MPH and Long G. I’ve circled the shift points on the graphs so you can see what you are looking for. Notice in the first graph displaying slower shifts, the MPH graph goes to a completely horizontal line. This means that for that distance, the car is actually not accelerating, and if you were to zoom in on this graph, you would notice that the graph actually decreases 1.3 MPH. You can also see that the Long G goes from a positive value to a negative during the shift! That means the car really is slowing down from the shift!  Now, on the second graph, notice the shifts are much faster. In fact, you can see the car actually never even stops accelerating! One of the ways we can see the shift points is the dip in the Long. G graph and the change in slop of the MPH graph. As we go faster, the aerodynamic resistance increases by a square of the speed (for all the non-math people – read it goes up a lot!), so the acceleration of the car increase at a slower rate. Take a look at your data. How do you shifts look? Any room for improvement?
0 Comments
Leave a Reply. |
Featured ArticlesHere is a collection of articles from some of the best professional coaches, drivers, and data engineers. Archives
May 2017
Categories
All
|
