
Sometimes we just need to look at things a little differently to reinforce what we’re seeing. Even though two different style graphs are showing the same information, we can get more out of one. It’s important to remember this when we’re looking at our data. Remember to look at things multiple ways to see which makes the most sense to you and is the most helpful.
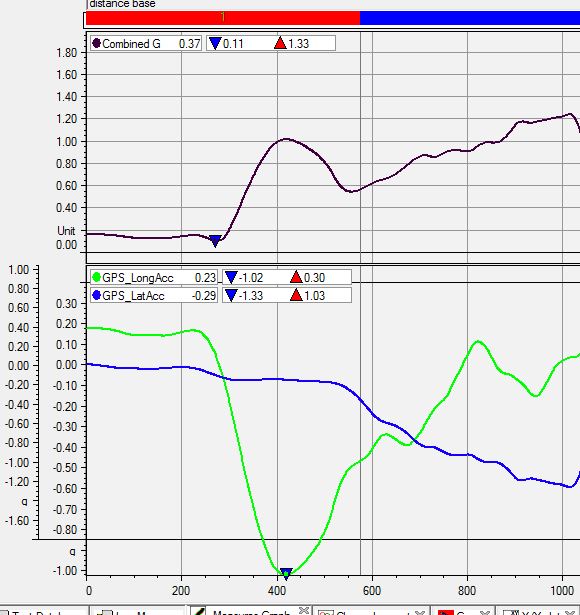
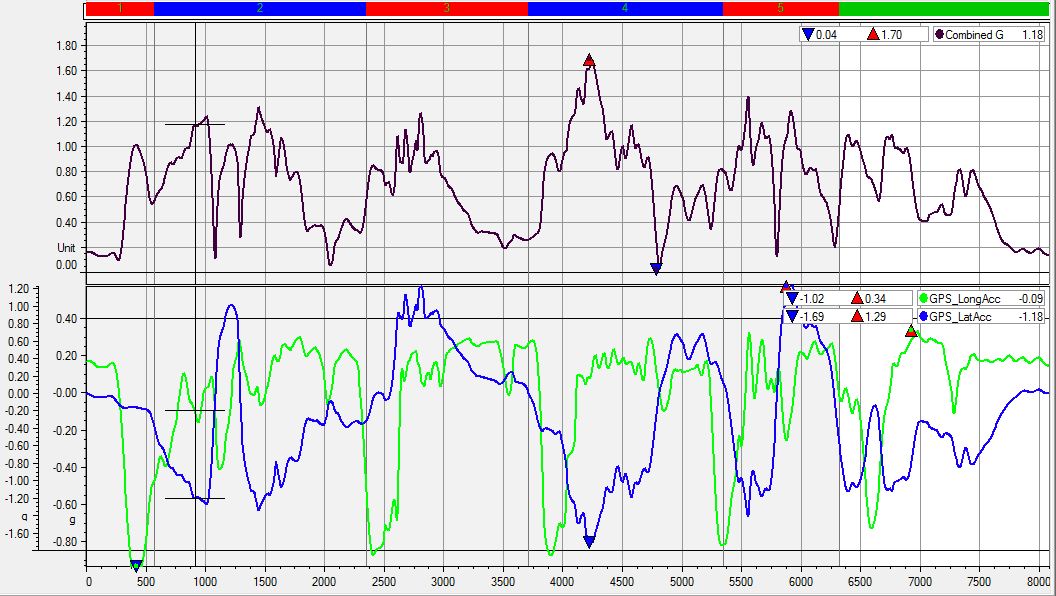
If we’re looking at Combined G (G Sum), sometimes it’s hard to get the full picture. For instance, take a look at the regular graph for a whole lap at NHMS. You’ll see that there is a dip in the first combined G in the transition from braking to turning in the first turn. You can see this even better in the close up to turn 1. Now, we can take a look at the Long G and Lat G info and see that there was a sharp let off of braking before the turn in commenced. Just like the site name, a little more trail braking was in order!
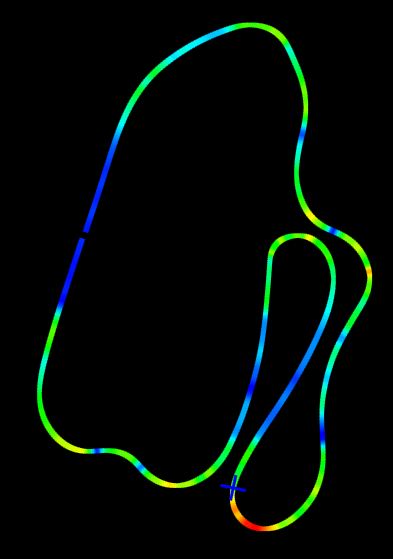
Now, if we use the colored track map (GPS option in Race Studio 2) we can see this a little quicker and easier. Notice the graph is blue down the front straight indicating low Combined G, transistioning to green under straight line braking showing more total G force, followed by a short section of BLUE on turn in, then back to green for mid-corner.
This quick visual analysis shows the driver braked and cornered at high G levels, but gave up some on entry. Looking at the colored map we can see they have some room for improvement in other corners as well.
This quick visual analysis shows the driver braked and cornered at high G levels, but gave up some on entry. Looking at the colored map we can see they have some room for improvement in other corners as well.
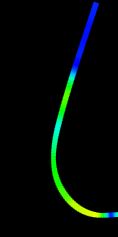
Now, is this any different than the line graph showing Combined G? No – it’s the same information, just displayed with colors instead of a line graph. Some will think it’s easier to read the line graph and some will think it’s easier to look at the colors. The important part is to remember there are multiple ways to look at data.
Just think of the different things you can display this way instead of Combined G. MPH, Lat G, Long G, Brake Pressures. What can we learn from those???
Just think of the different things you can display this way instead of Combined G. MPH, Lat G, Long G, Brake Pressures. What can we learn from those???
 RSS Feed
