Racing exists somewhere between your reflexes and deliberate action - its a sport where remembering what you did right or wrong isn't always easy. Its hard to see where to improve by just watching - there are sights, sounds and G-forces that just can't experience outside a race car. Practice takes a bit more planning and effort than most sports, so getting better can mean thinking about what your driver between stints behind the wheel. The thing is, simply replaying laps it in your mind isn't enough; you need to compare them to some reference to know if you were actually faster or slower. Data acquisition helps fill this gap of analysis.

By recording what a car did on track, one can better recall some of the inertial and sensory experiences, and correlate these with faster speeds and lower times. You can train yourself on the best ways to act, react and anticipate - away from the car. Like most other technologies, its getting smaller, cheaper and easier to use. There've been big advances in the entry level, so let's kick off 2012 with a guide to getting started with data acquisition. There are many great books and articles on reading an analyzing data, so today we'll focus on the basics. We'll start with an intro to how GPS has come into data acquisition, then we'll talk about using displays that show lap times. We'll follow that with a discussion on time/distance plots and driving lines, and give a simple examples of how one might use this information. I'll touch on important considerations when choosing entry-level systems, and we'll finish by touching on making the transition to using more data.
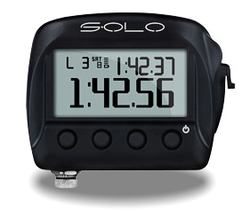
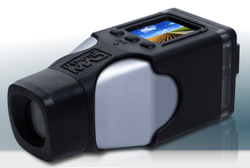
GPS has nearly changed the definition of "where" as it pertains to an outdoor location on Earth. For better or worse, you can now tell where something is anywhere on the planet, within feet, in real time. When it comes to race car data acquisition, its a great asset. One milestone was MOTEC's "RaceGrade GPS" series. When coupled with MOTEC Data Loggers, they provided real speed & position data accurate enough to compare the acceleration, braking & driving lines of two different vehicles or drivers. Another milestone was AIM's SmartyCam - one of the first GPS overlay cameras to feature data/video combination capabilities in a rugged, compact package. In the last few years, companies like Traqmate, GET and XT Racing have come out with GPS lap timers, and AIM's recent release of the Solo has really cause a surge in demand. The addition of GPS to data systems means no sensors are needed to tell you how the vehicle is moving, what speed its going and what the times are. What used to involve a bunch of temperamental and expensive sensors spread around a car or bike, connected with easy to damage wiring harnesses, have now been replaced with a single, palm sized-box. The AIM Solo has some groundbreaking features at a price not much more than old-school lap timers; for this reason we're going to use it as our example today.
One of the simplest ways data acquisition works is by allowing you to compare times. Going faster, whether its than a clock or another car, is what racing's about. Whether its section, lap or even outing times, being able to pick out fast from slow is a first step in learning what works. A stopwatch was one of the first data tools out there, and its still one of the most important. Most data systems include some sort of lap time display, and this is an important tool that can be used while on track. This, combined with section or split times, gives you an idea of what you're doing right while you're out on the track. The AIM Solo makes this easy since it comes pre-loaded with information about the start/finish line for most North American tracks, and can even automatically detect where it is. This minimizes setup - you just turn it on and it will start telling you lap times. Simple setup is really good when you are learning something new - you can concentrate on learning how to use it instead of focusing on getting it to work in the first place.
A good data acquisition lap time display takes the stopwatch concept a step further. There are many variations, but some major ones are:
· Lap Time - how long does a lap take.
· Best Lap Time - which was the fastest lap, and what was its time.
· Lap Gain/Loss - While on track, how fast or slow are you compared to the fastest lap.
· Split/Section/Sector Time - the time between two points on track. Its possible to have best splits & gain/loss on some displays, but for this discussion its not important.


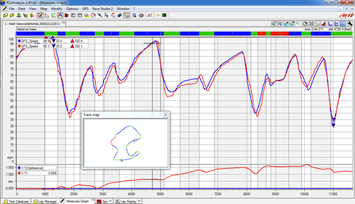
· Reference Trace - A line which show what a recorded value is compared to track distance or position. In the example below, its the blue line.
· Overlay - A second line which shows the same data from another lap. In the example below, the top red line.
· Compare - A line which shows how much faster/slower one lap is than another. In the example below, the bottom red line.
· Track Sections - The green and blue headings at the top which show turn number.
· Track Map
Looking at just the reference and overlay a number of interesting comparisons can be seen. First note that as I got more comfortable with the car, my corner speeds increased. You can see this by comparing how the lines dip - note the minimum speeds on the blue lines are generally higher. Also, you can see that my speeds out of the corner got generally quicker. This is demonstrated by how the blue lines start increasing from their low values earlier. These things are to be expected; as we get familiar with a car and track, we carry more speed through corners and we pick up the throttle sooner. Its all interesting stuff, but nothing you'd necessarily need a data system to teach you.
The real power of data is when it shows you less obvious details, like how certain sections of the track interact. For example, notice that my braking points didn't change much. You can tell this because the point where the lines start to decrease from their high points don't change much. In fact in turn 5 (officially called 4 at Laguna, the left hander at the bottom of the hill where it joins up with the old track), I actually started breaking earlier and carried much more speed through the corner. What happened here? Going back to my recollection of the session, the car wasn't particularly happy under trail braking, and was very quick to rotate. As I got faster, more aggressive braking just upset the chassis and made the car scrub more speed at the apex of the corner. This isn't something that I might have noticed since late braking feels fast. Here, I have an example that shows how earlier, straight-line braking actually resulted in a better mid-corner speed. Armed with this information, I might go out in the next section concentrating more on braking consistency and turn-in rather than braking later. Then I might look at my times on the track and see if this technique actually gets me around a section faster.
The other part of this plot that's interesting is the red compare line at the bottom. This allows me to see how my lap time was increasing and decreasing overall. Notice that the line peaks at about 10,000 feet (shown on the scale at the bottom of the graph) and then drops down a bit. At that peak, I was 1.5s faster, but then I lost .3 seconds in the last bit. How'd this happen? Well, you can see some interesting differences going through turn 10 - the car was faster in the braking area, but then slowed on mid-corner and exit. Going back in my mind, I remember passing someone on the entrance on a particularly fast lap. This put me off-line, forcing me to pinch the exit and scrub some speed. Now I know that the lap time, without that other car, may have actually been .25s faster!

1. What accessories are available?
2. What kind of technical support is offered?
3. Does the company have more advanced systems you can grow into?
4. What other people use this system, and can you compare data between systems?
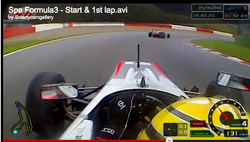
Accessories allow you to make the most of the system in your car. When looking at a system, you need to see what sorts of options are offered by the manufacturer which can increase the usefulness of the system. At most basic, this may include power cables & mounts. More complex options may includes external sensors, ECU connectivity and video options. The AIM Solo has an internal rechargeable battery, but can also be powered by a cigarette lighter adapter or hard-wired into the car. It comes with a mounting bracket but they also make a suction-cup mount for windshield use. They make a model called the Solo DL that features ECU connectivity - which this you can connect to many car and motorcycle engine management systems and record things like throttle position, RPM, temps and pressure. This can be really helpful for expanding the power of your analysis and also seeing how the car's engine is behaving. The DL can connect with another great product, the AIM SmartyCam. This is a camera that can have data overlaid on the picture, so you can see data alongside your video. For driver development, this is an important feature because nothing jogs your memory like watching the lap from inside the car. Having a tool like this easily accessible makes it easier to draw conclusions from your data, make changes and watch how they worked. Above, you can see the video with track position, speed, G-meter, brake, throttle, gear, lap number and time all displayed on the screen.

The last part of this article is about moving onward from simple, GPS-based speed & position recorders. As you become more skilled at analyzing data, it becomes important to see how the driver inputs effect the car's performance. Steering, brake pressure, gear & throttle are how we get the car to do what we want it to do. More advanced systems have inputs where you can get this data - usually from external sensors. Having these make the system more complex and means some maintenance may be required, but really opens doors to figure out how one can manipulate the controls to go faster, and also about how the car is reacting to them. As you become more familiar with driver inputs, it may get interesting to look at chassis data. Suspension potentiometers can tell us how the car is moving - knowing roll, pitch & yaw can help develop setups and see how the car reacts to the same inputs with a different setup. You can evaluate engine performance with exhaust oxygen sensors, pressures and temperatures, and AEM even makes a driveshaft sensor so you can look at torque and horsepower. In the second installment of this series, we'll have a look at some of these possibilities and how to choose what's right for you and your car.
Neel became involved in motorsports while in high school in the Chicago Area.
At the University of Wisconsin-Madison, he was involved in hybrid-electric vehicle development and internal combustion engine research. Neel later worked as Technical Support Manager for EFI Technology in Torrance, CA supporting teams in series including Champcar, IRL, ALMS, Speed World Challenge, and Grand AM.
In 2003, he founded Apex Speed Technology. Currently, Apex Speed Technology has a full-time staff of 7 who supports customers in club and professional series worldwide and is a dealer for most major lines of data acquisition, engine management & motorsports video systems

 RSS Feed
