
It’s time we get back on track with the blog and keep learning from our data. One thing lots of people say (which works really well) is to get someone faster in your car to see what they are doing. This works great when there is a pro, or even data from someone quicker than you in a similar car to share data with. By having their data, you can see where their inputs (throttle, steering, and brake) are different. With the help of GPS, we can even look at line differences.

Besides looking at the traces themselves, one thing that almost all data packages have is called Time Compare, Time Variance, Time Gap, or a few more names. It’s usually listed on the bottom of the other graphs and will lists seconds on the vertical axis. This graph is probably the easiest place to see where two drivers are varying in lap times. The time variance is highlighted in the first graph.

The graph charts where and how much a drivers lap time is varying from the other. The graph is actually a very easy one to read – anywhere the graph is going up, the time difference is growing. Anywhere the graph is going down, the time difference is getting smaller. So, if we look at the first example, you’ll see that from the very start the lap is slower because the graph is going up from 0 to around 650 feet. This means that the slower lap was losing time right off the start.
Now, interestingly, you’ll see that the time variance graph pretty much levels out (highlighted in figure two). That means that at that point, the two laps were at about the same pace. Next, just after 1500 feet, you see that the time variance graph increases sharply, meaning that the time difference is growing again. What can be of even more interest is where the graph is decreasing – as shown in the third graph. This is an area where the slower lap was gaining time on the faster (or reference) lap.
Now, interestingly, you’ll see that the time variance graph pretty much levels out (highlighted in figure two). That means that at that point, the two laps were at about the same pace. Next, just after 1500 feet, you see that the time variance graph increases sharply, meaning that the time difference is growing again. What can be of even more interest is where the graph is decreasing – as shown in the third graph. This is an area where the slower lap was gaining time on the faster (or reference) lap.
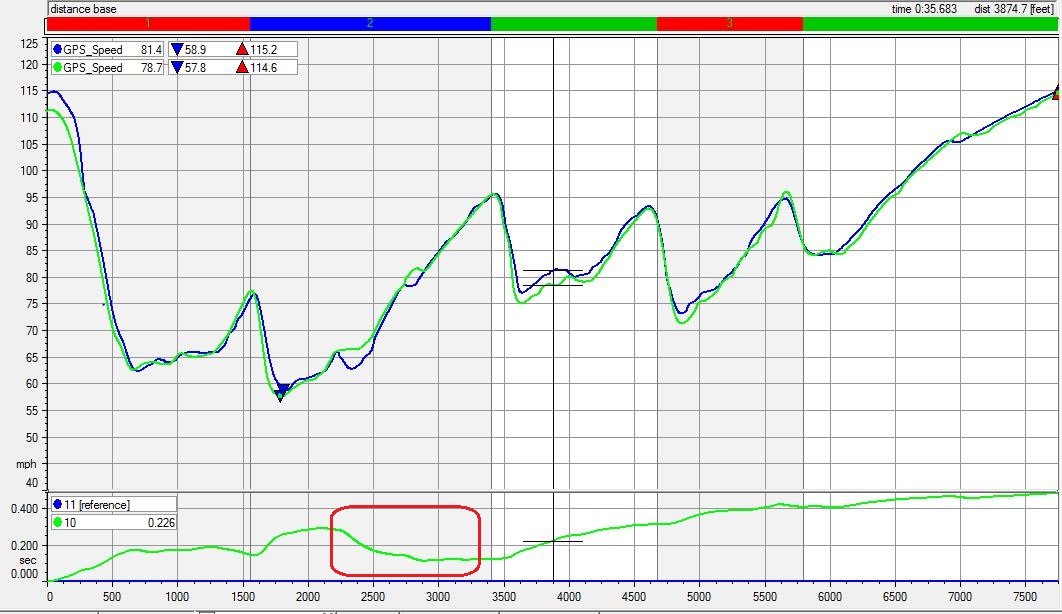
So, with very little searching, the time variance can show you where to investigate further. It will show you the areas where one lap is significantly better or worse than another. In the previous examples, the lap time difference was .489 seconds. When we look at laps that are even closer in time, we can see some subtle and not so subtle things.
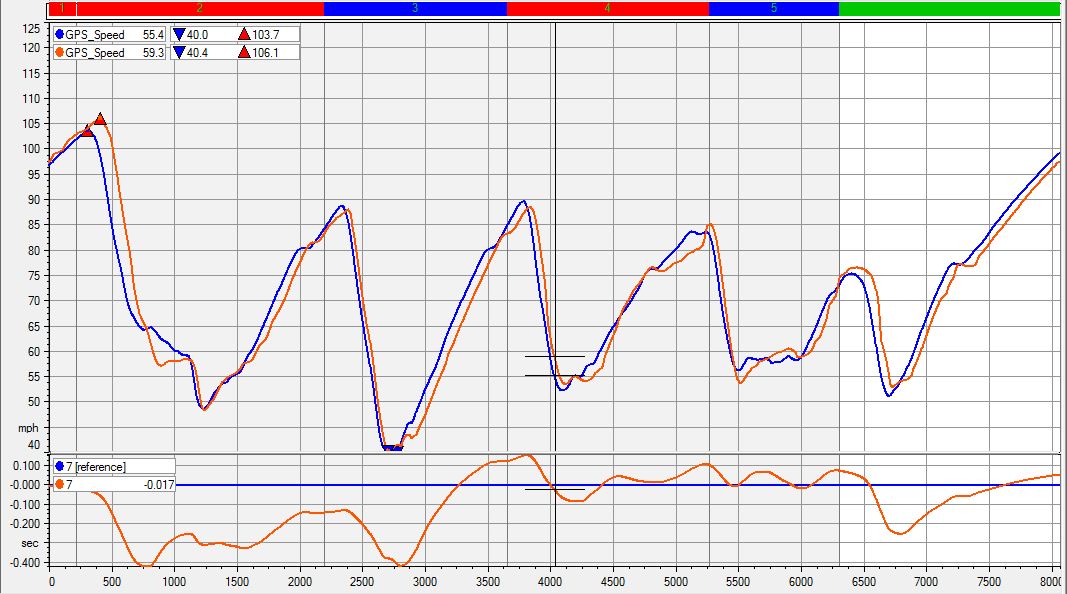
The next figure shows two laps that are only .057 seconds different. Notice how the slower lap was at one point around .4 seconds faster, but ended up .057 seconds slower. This means that if you can put together the fast sections of the slow lap with the fast sections of the fast lap, we can potentially go .4 seconds faster overall! To do that, you have to then dig further into the data. Was it a throttle input that made things quicker? Better steering inputs? Later braking? More trail braking?
Just like when we started, we don’t now the “why” but we know now the where. With the Time Variance graph, we have a place to look to see where we went fast or slower, giving us an area to investigate further.
Just like when we started, we don’t now the “why” but we know now the where. With the Time Variance graph, we have a place to look to see where we went fast or slower, giving us an area to investigate further.
 RSS Feed
